Further Reading & Resources

I am glad you are enjoying the book so far! If you found your way here, then you came looking for one of the resources or links we promised in the book. If you just want a quick look, they are right here on the page, and if you want a download to save for later, we gave you that option too!
Enjoy!
-Cory
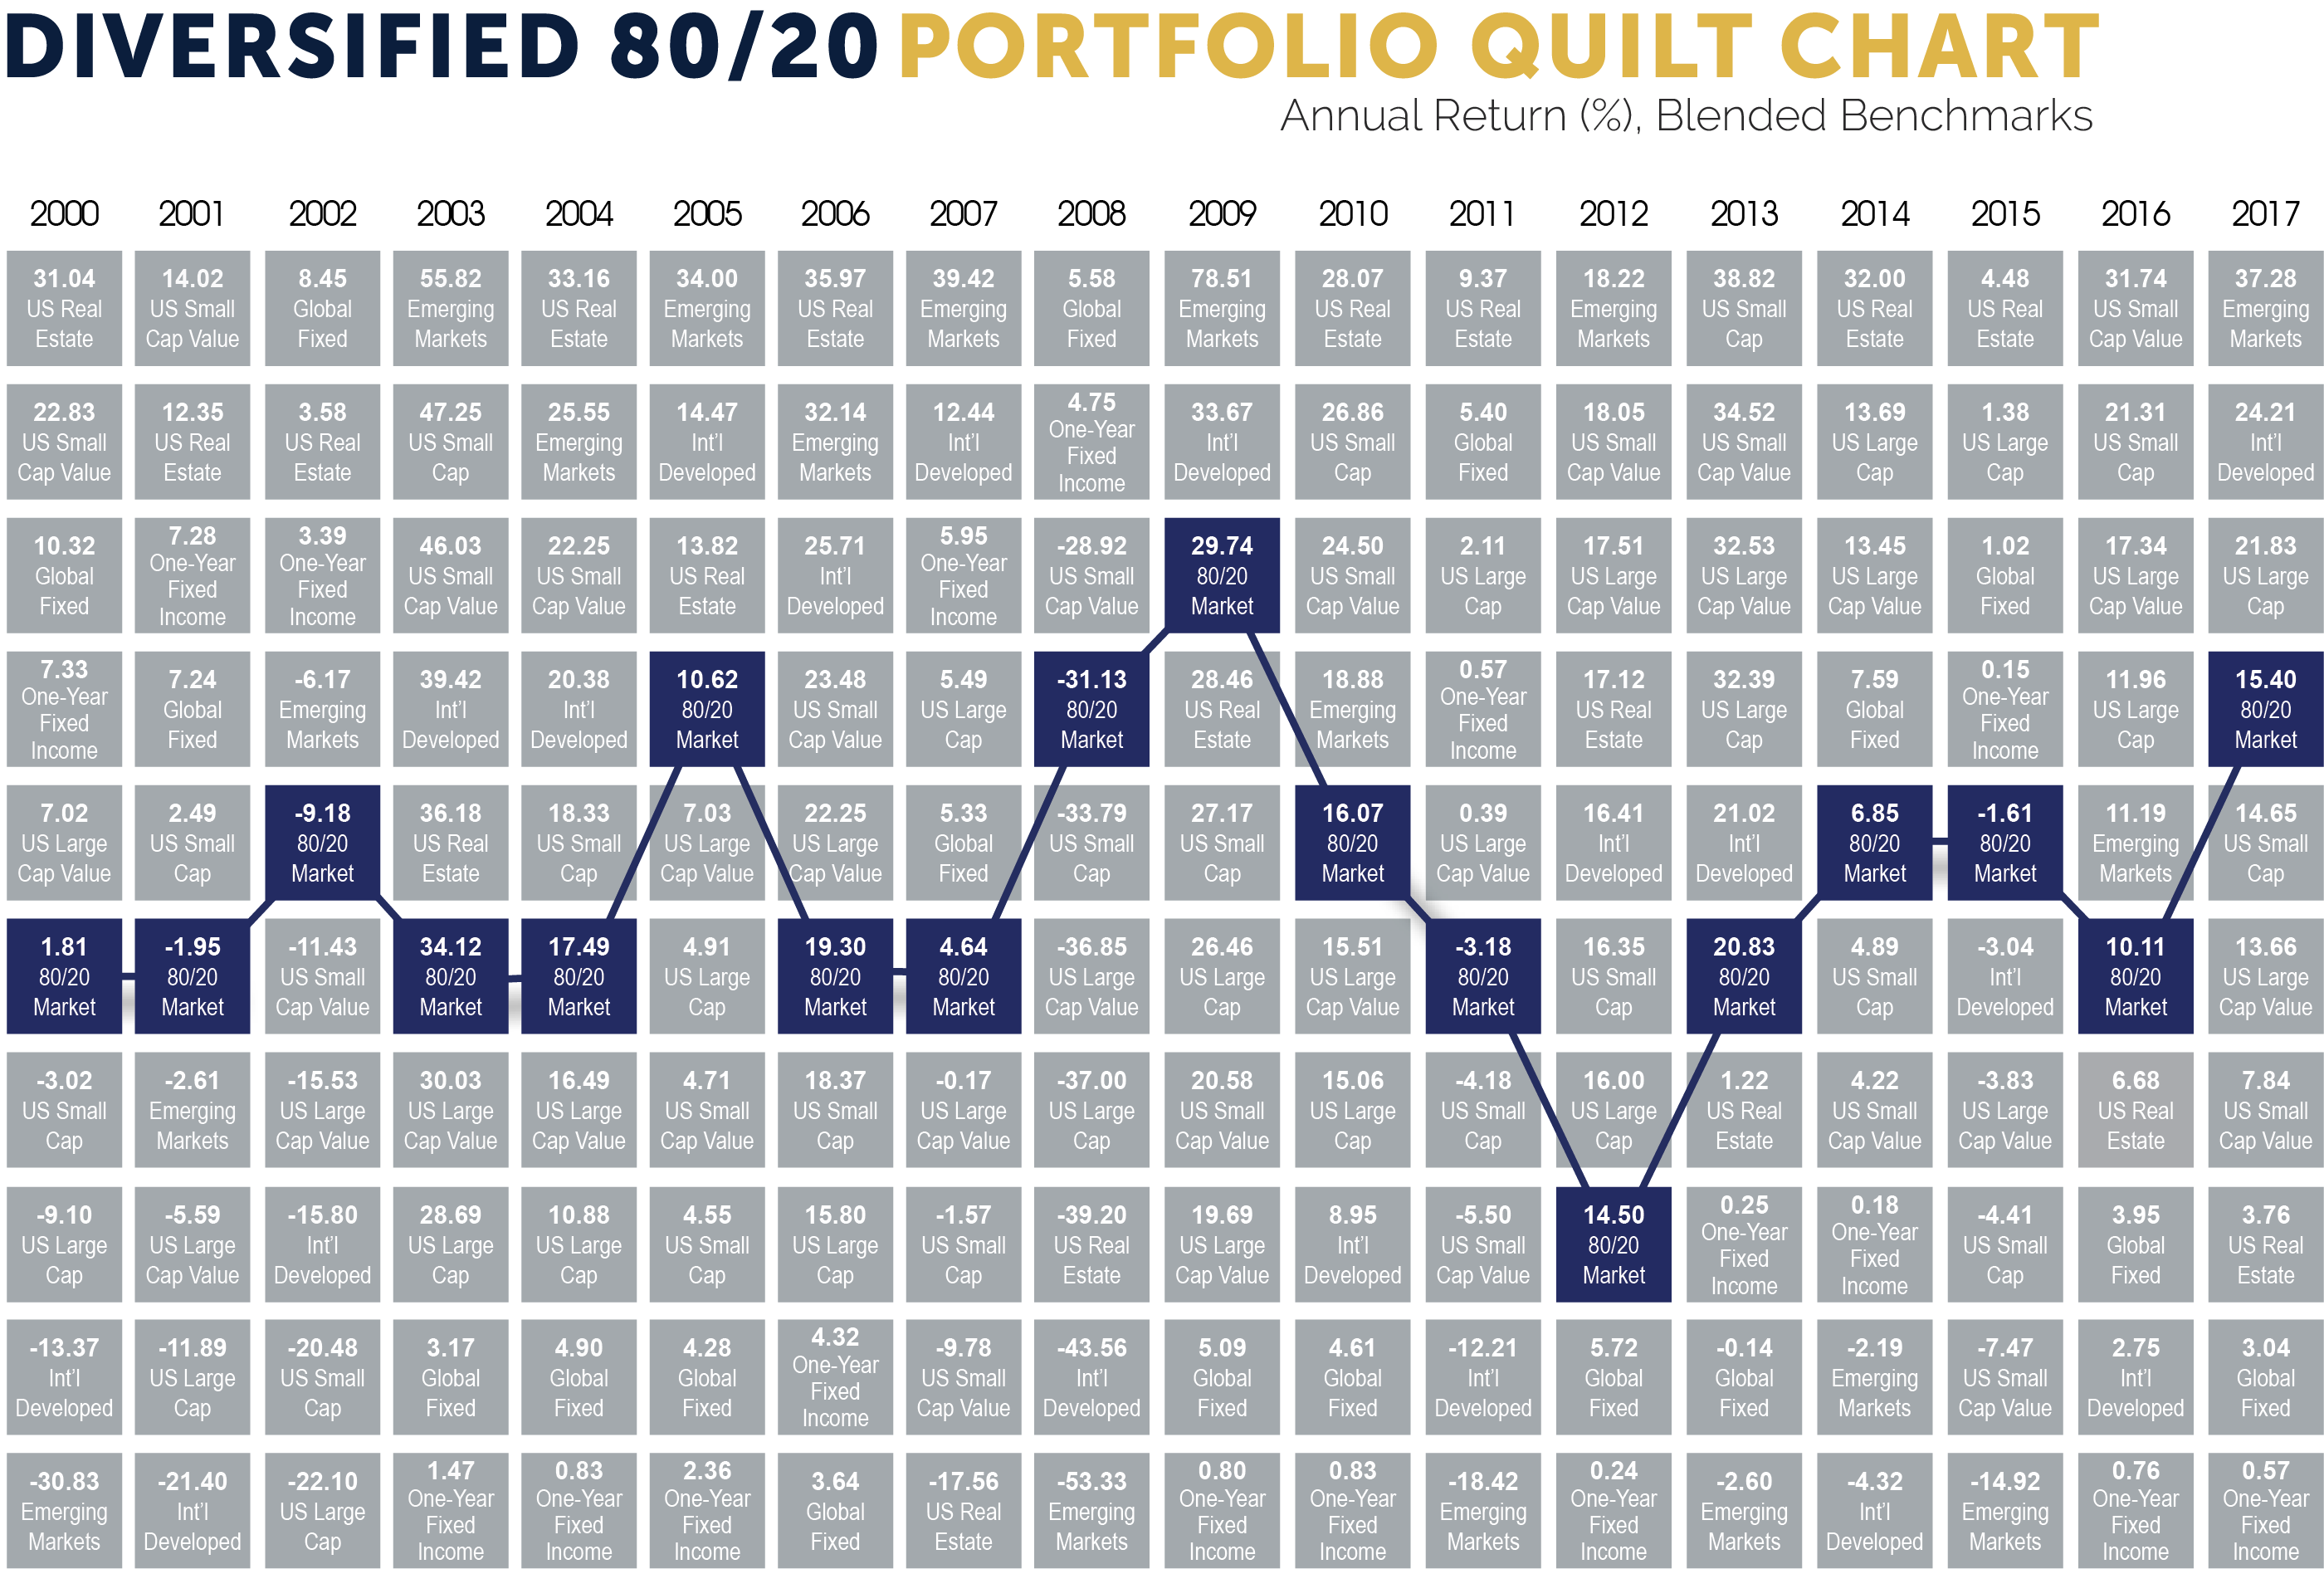
Callan (Quilt) Chart (page 88)

Download the PDF Version Here!
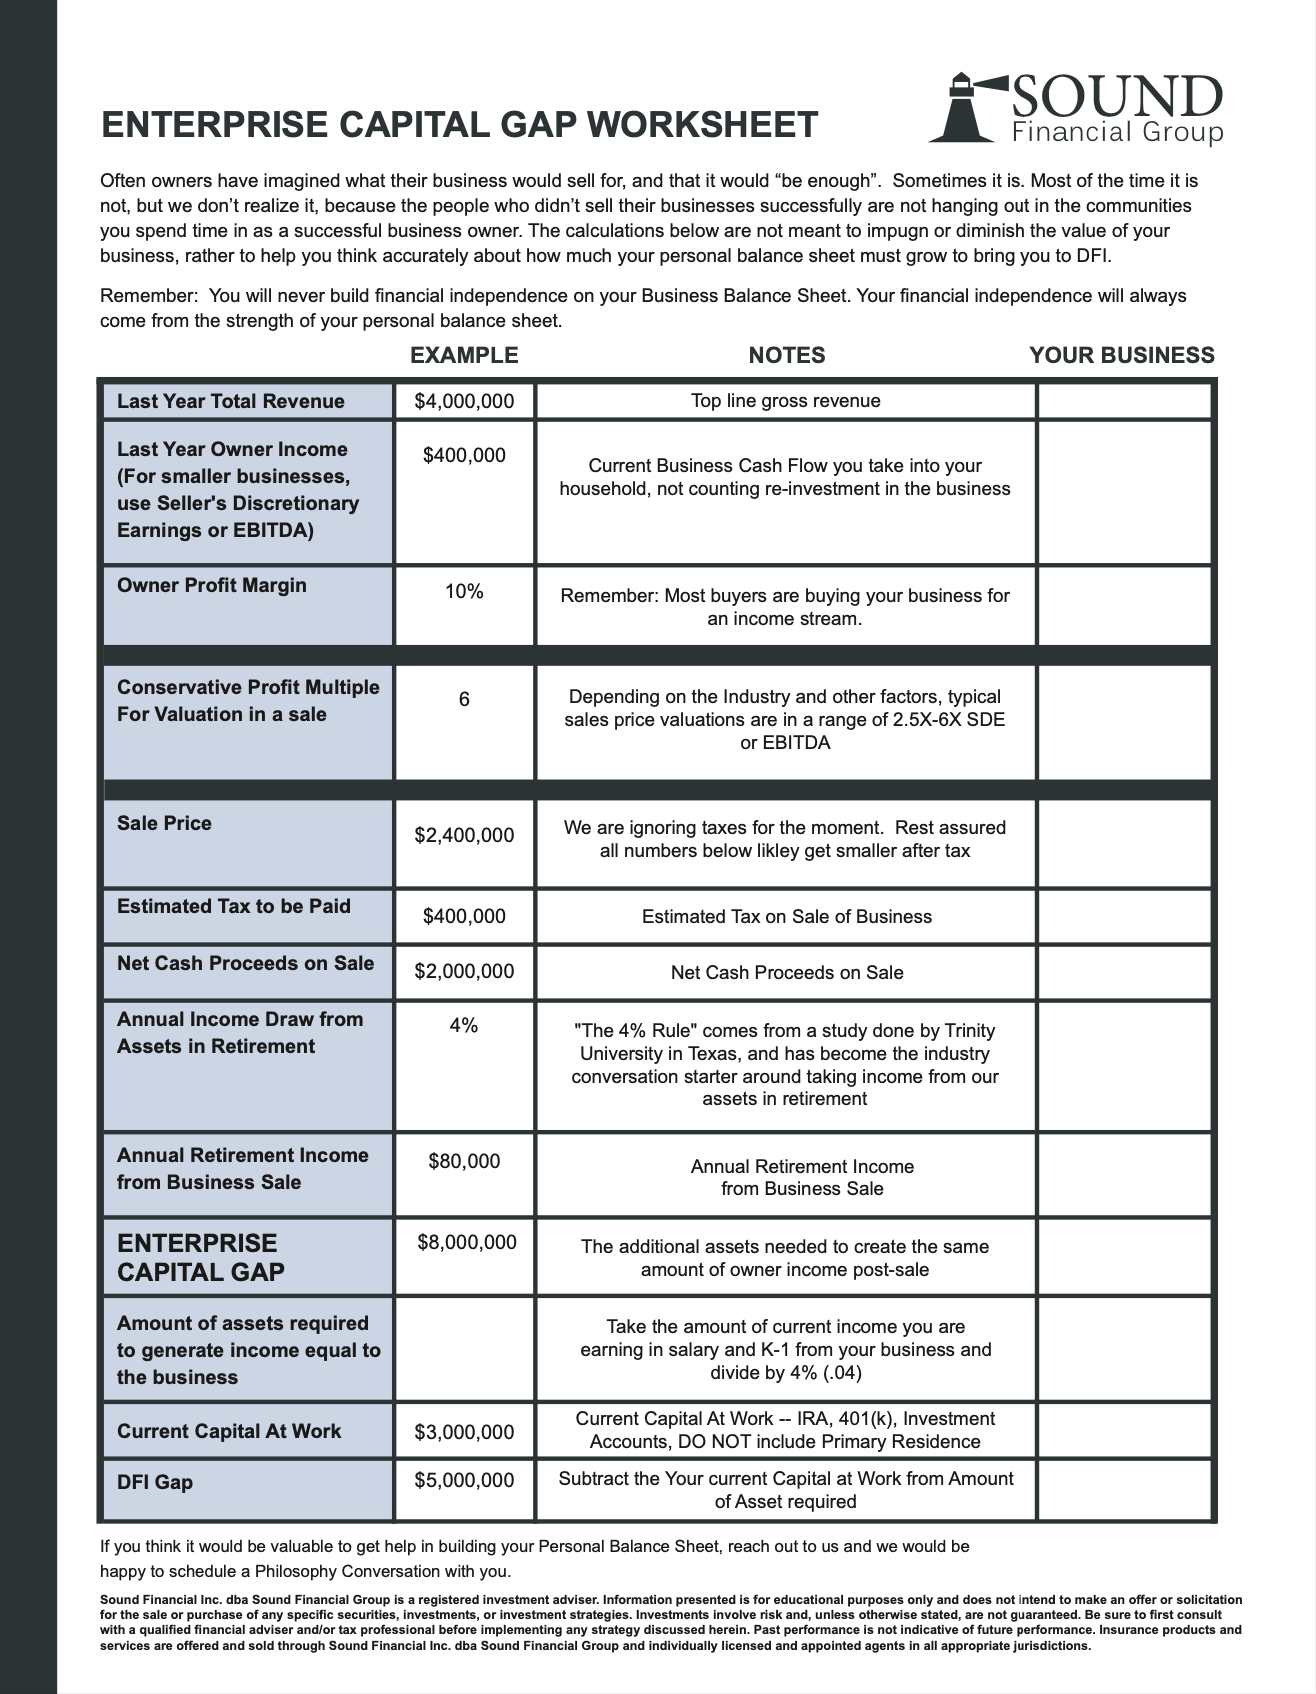
Enterprise Capital Gap Worksheet (page 56)

Download the Worksheet PDF Here!
Further Reading Links
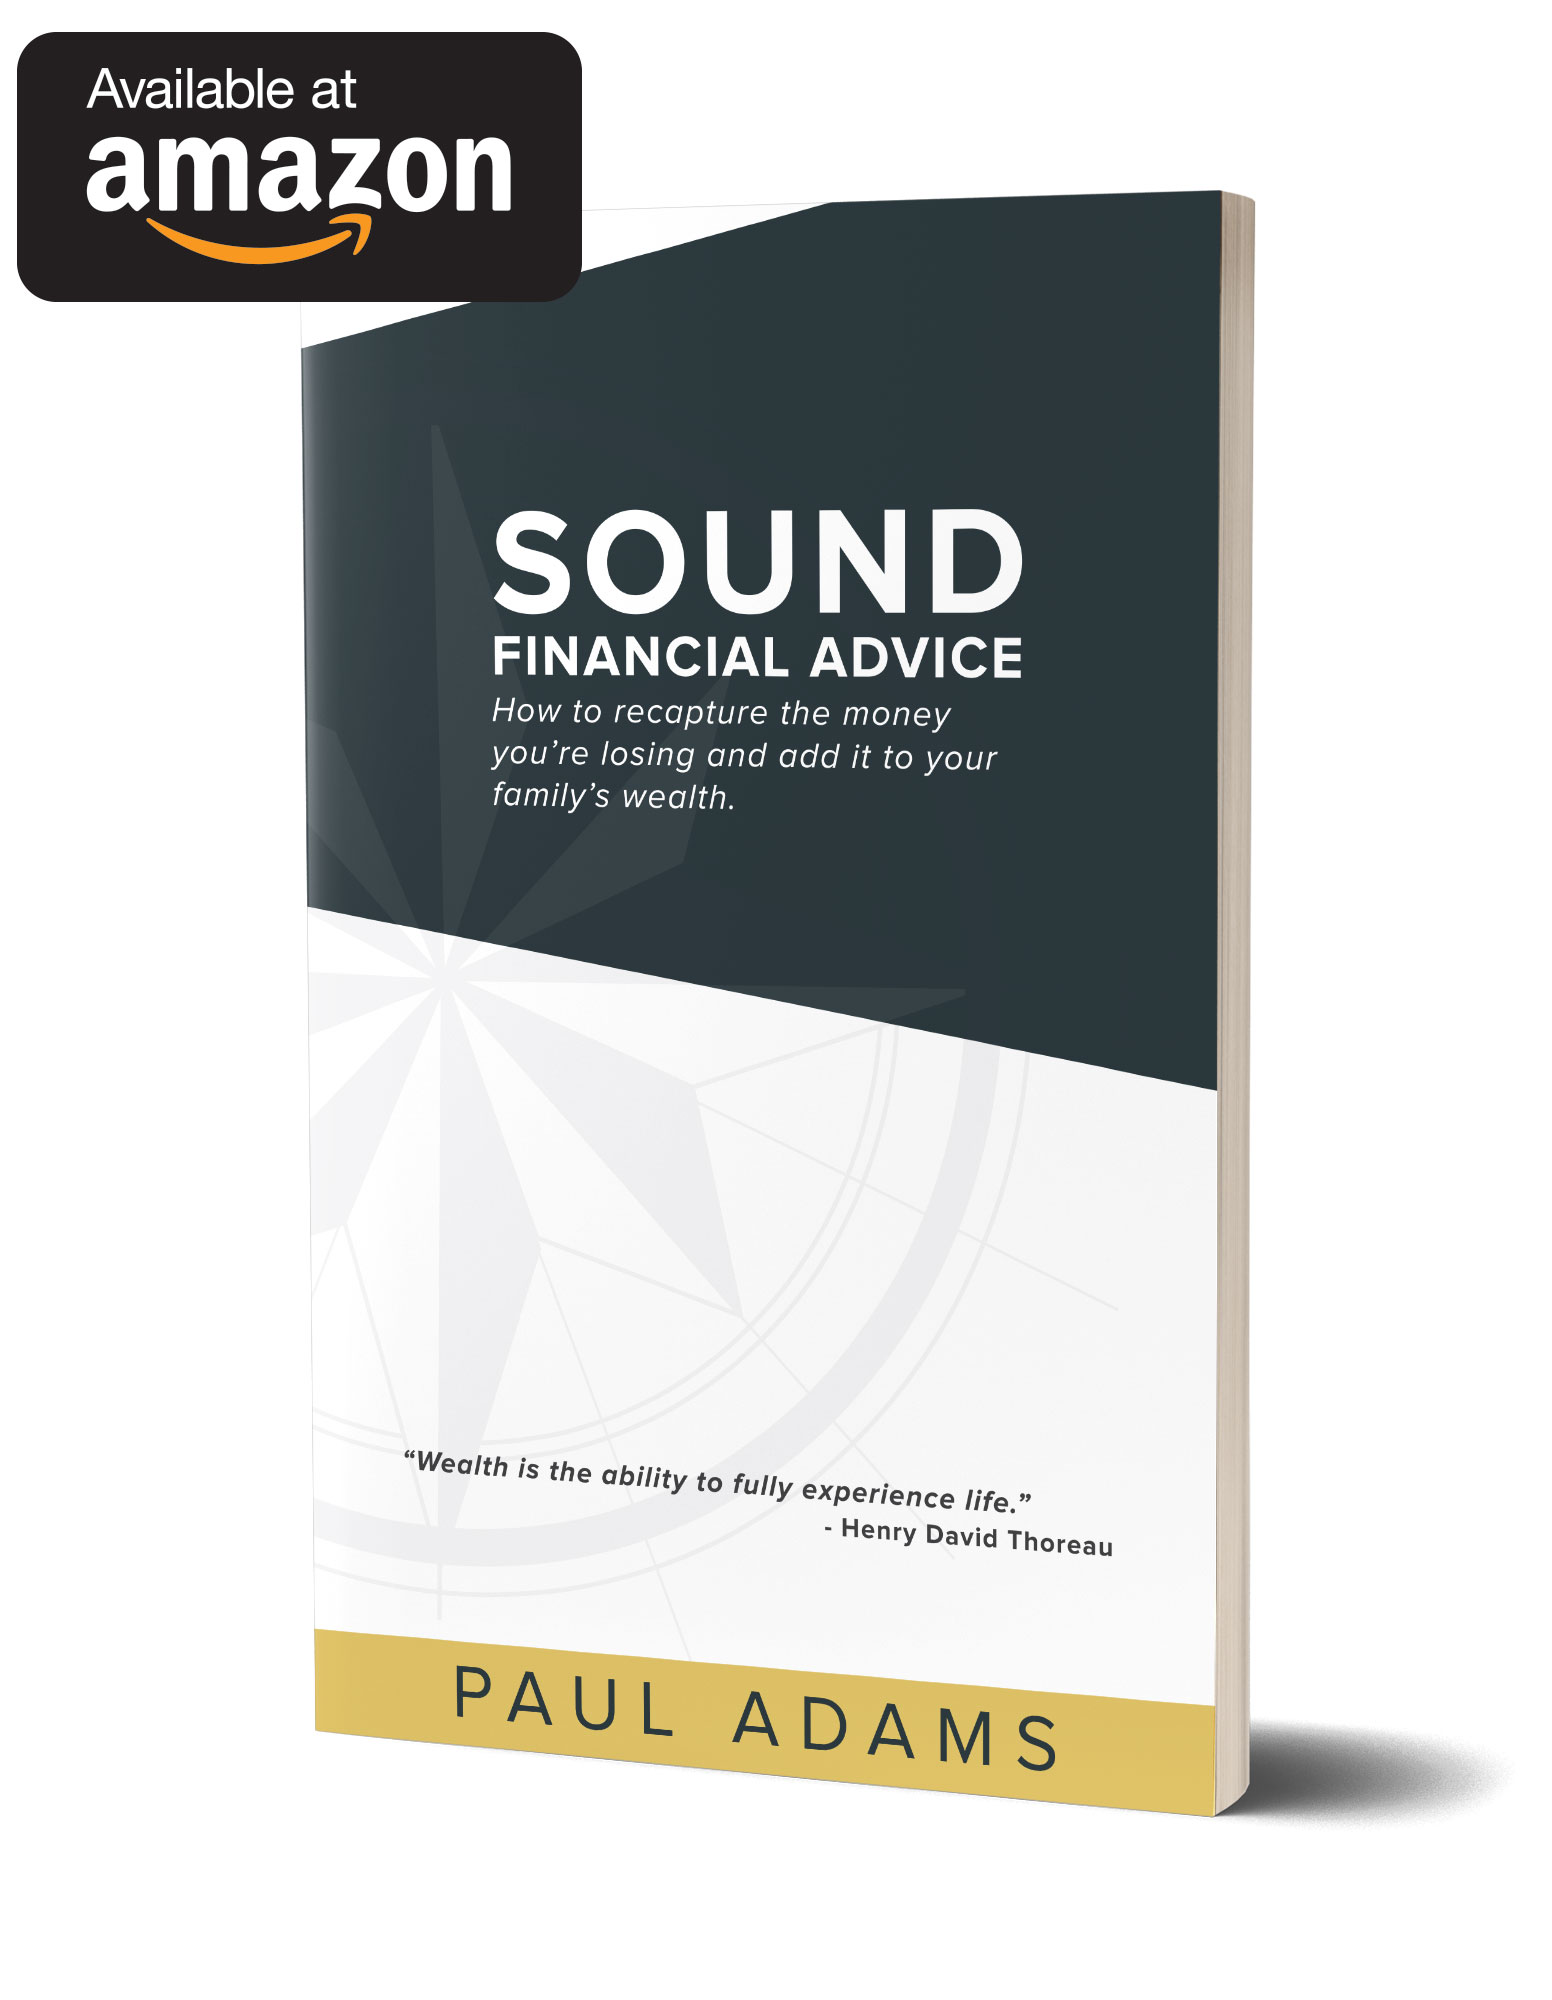
Other Books by Paul & Cory on Amazon
Any indices and other financial benchmarks shown are provided for illustrative purposes only, are unmanaged, reflect reinvestment of income and dividends and do not reflect the impact of fees. The effect of the deduction of fees and expenses, including the compounded effect over time may be significant. Investors typically cannot invest directly in an index. Dimensional Returns 3.0 is the source for each index and financial benchmark included in this report. US Large Cap is the S&P 500 Index, provided by Standard & Poor’s Index Services Group. US Large Cap Value is the Russell 1000 Value Index. US Small Cap is the Russell 2000 Index. US Small Cap Value is the Russell 2000 Value Index. Russell data © Russell Investment Group 1997-2017, all rights reserved. US Real Estate is the Dow Jones US Select REIT Index, provided by Dow Jones Indexes. International Developed is the MSCI World ex USA Index (net div.), © MSCI 2017, all rights reserved; see MSCI disclosure page for additional information. Emerging Markets is the MSCI Emerging Markets Index (gross dividends), © MSCI 2017, all rights reserved; see MSCI disclosure page for additional information. One-Year US Fixed is the BofA Merrill Lynch 1-Year US Treasury Note Index, used with permission; © 2017 Merrill Lynch, Pierce, Fenner & Smith Incorporated; all rights reserved. Global Fixed is the Barclays Global Aggregate Bond Index, provided by Barclays Bank PLC. 80/20 Blended Benchmark Allocation is 5% ICE BofAML 1-Year US Treasury Note Index, 5% ICE BofAML 1-5 Year US Treasury & Agency Index, 5% FTSE World Government Bond Index 1-3 Years (hedged to USD), 5% FTSE World Government Bond Index 1-5 Years (hedged to USD), 8% MSCI EAFE Value Index (net div.), 4% MSCI EAFE Small Value Index (net div.), 2.4% MSCI Emerging Markets Small Cap Index (net div.), 16% Russell 1000 Value Index, 20% Russell 2500 Index, 12% Russell 3000 Index, 8% Dow Jones US Select REIT Index, 2.4% MSCI Emerging Markets Index (net div.), 3.2% MSCI Emerging Markets Value Index (net div.), 4% MSCI EAFE Emerging Markets Small Cap Index (net div.); rebalanced annually. Past performance does not predict future results. Returns longer than one year are annualized from monthly data and portfolios are rebalanced annually. For portfolio construction, major indices are used to represent a specific asset class. This is for illustration purposes only and is not representative of an actual investment. For more complete information, including mutual fund charges and expenses, contact your financial advisor for a prospectus. Read the prospectus carefully. IMPORTANT INFORMATION ABOUT INVESTMENTS: NOT FDIC-INSURED, NO BANK GUARANTEE. MAY LOSE VALUE, NOT A BANK DEPOSIT, NOT INSURED BY ANY FEDERAL GOVERNMENT AGENCY. OBS Financial is a Registered Investment Advisor with the Securities and Exchange Commission.


